ARCH653 Final Project
Parametric BIM Applications - Creative Design and Optimization
INTRODUCTION
There are two parts in the final project. Part one is about using parametric BIM through visual programming. Part two is about parametric BIM-based design optimization.
PART I: Parametric BIM through Visual Programming
PROCESS OF CREATING TRUSSES
 |
| Figure1-- Trusses_1 |
 |
| Figure2--Trusses_2 |
The trusses can be separated into three parts to create in Revit. The first part is three arcs connect at the same start and end point. The second one is the triangle shapes separate equally between the start and end point of arcs. The last one is X shapes between sides of the triangles. I'm going to explain how I create the trusses in Revit step by step.
Step 1_ Three Arcs:
At first, I used conceptual mass file to make the arcs, but it's really hard to load the mass into the project one. It was difficult to rotate the trusses to the right direction in the exoskeleton file. Thus,I tried to use adaptive components to create the arcs. I make the start and end point of the arcs to be adaptive points. Then, I used the drawing tool of the start-end-radius arc to draw the arcs. The result is showed in figure 3.
 |
| Figure3-- Three arcs of trusses |
 |
| Figure4-- Family type for the arcs |
Step 2_ Triangle Shapes:
I used Dynamo visual programming to create triangle shapes and X shapes. Figure 5 is the entire Dynamo program used to create the two shapes. On the top of figure 5 is for triangle shapes showed in figure 6. I'm going to explain how I make it step by step.
 |
| Figure5-- Entire Dynamo program |
 |
| Figure6-- Dynamo program for triangle shapes |
First, I need to select model elements. There are four lines I need to select. That is the central straight line and the three arcs created in step 1. The result is showed in figure 7.
 |
| Figure7-- Select model elements |
Second, I need to find points for an adaptive component showed in figure 8. The adaptive component can be altered by changing parameters in the family type. It has three adaptive points, so I have to find three points in a group to form the triangle shapes.
 |
| Figure8-- Adaptive component for triangle shapes |
 |
| Figure9-- Find points on the arcs |
Third, I need to delete the first and last point on the arcs because the three arcs have the same point at these two points. I need three different points to create the adaptive component, or the Dynamo can't run successfully. The Dynamo program about this part is showed in figure 10.
 |
| Figure10-- Delete the first and last point on the arcs |
Last, created the triangle shapes from points found above. The result is showed in figure 11.
 |
| Figure11-- Triangle shapes |
Step 3_ X Shapes:
The real X shapes are presented in figure 12. Each X shape has 4 points on two arcs. Each arc has two points on it. We can find the Dynamo program for the X shapes at the bottom of figure 5. I'm going to explain the process of the Dynamo program in figure 13 from left to right.
 |
| Figure12-- Real X shapes |
 |
| Figure13-- Dynamo program for X shapes |
I need to find points for an adaptive component in figure 14. There are 4 adaptive points in the component, so I have to find four points in a group to make the X shapes.
 |
| Figure14-- Adaptive component for X shapes |
First, I tried to find points on the arcs in the sequence of numbers showed in figure 15. The Dynamo program about this part is showed in figure 16.
 |
| Figure15-- Find points for X shapes_1 |
 |
| Figure16-- Find points for X shapes_2 |
Then, tried to find 4 points in a group to form the X shapes. The result of the four points should be in the sequence of numbers showed in figure 17. The Dynamo program about this part is showed in figure 18.
 |
| Figure17-- Find points for X shapes_3 |
 |
| Figure18-- Find points for X shapes_4 |
Last, formed the X shapes from points found above. The result is showed in figure 19.
 |
| Figure19-- X shapes |
RENDERINGS
Below are the pictures of Burj Al Arab in Revit after adding the trusses.
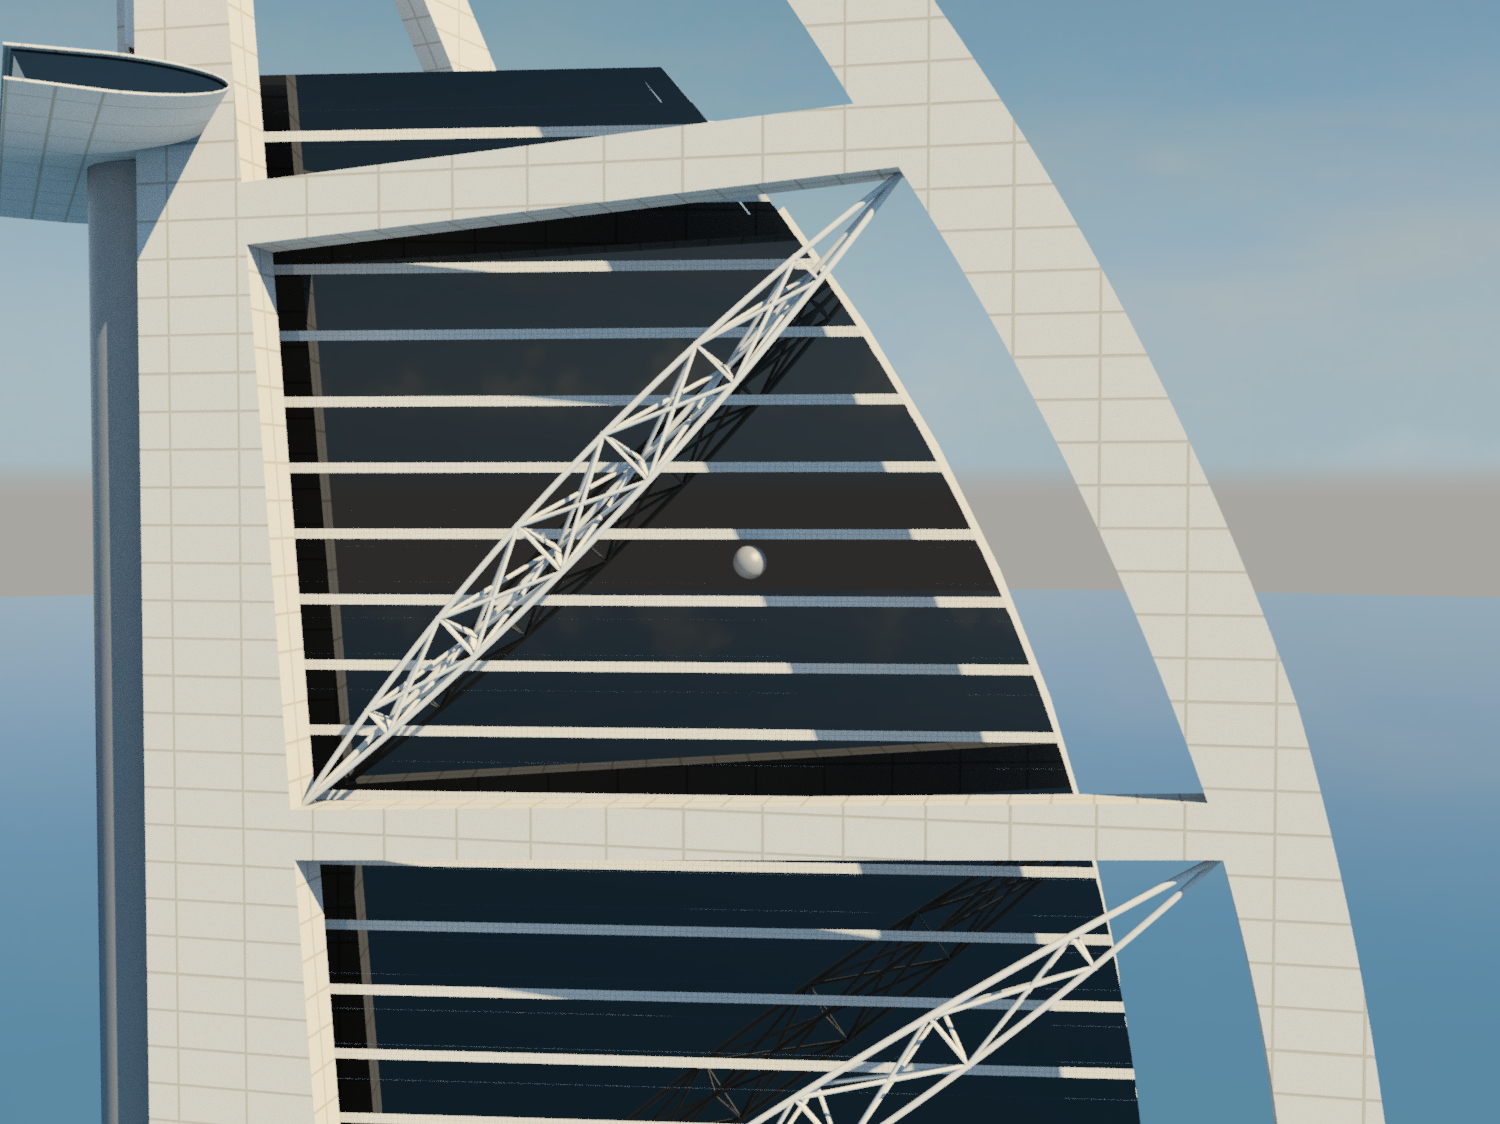 |
| Figure20-- Trusses_daytime |
 |
| Figure21-- Trusses_sunset |
 |
| Figure22-- Trusses_nighttime |
 |
| Figure23-- Burj Al Arab |
PART II: Parametric BIM-based Design Optimization
Professor Wei Yan gave us some examples about a design optimization. Our goal is to update the Dynamo program of the examples to get the lowest Energy Use Intensity (EUI) for the SFO Admin Campus Buildings. I'm going to explain how I changed the program to my final result step by step.
 |
| Figure24-- Bird's-eye view of the buildings |
Step 1_ Building Dimensions:
I need to find the site boundary first. The site boundary of the SFO buildings is given, but it has already included the campus parking structure. I measured figure 24 to get a new site boundary just for the two Admin buildings. Then, I gave a fixed distance 82-ft between the two buildings. The Dynamo program about this change is showed in figure 25. I did the change in the "Building Generator” node.
 |
| Figure25-- Dynamo program_fixed distance between two Admin buildings |
There is a constraint different from the previous example, which is "Number of floors." It was "Floor Height" in the previous example. The building height is an input. When I have the building height, I can either get the floor height or the number of floors. Thus, I switched the two nodes and changed some connections between them. Figure 26 is about the change I did in the "Building Generator” node.
 |
| Figure26-- Dynamo program_number of floors |
Step 2_ Building Volume:
There is a project goal for the building volume. I can change some nodes in the "Test Optimo" node to achieve the goal. I've tried two methods to achieve this goal. The first one is to minimize the absolute value of the difference between the target building volume and the building volume that calculated by the input building dimensions. The way that I've done is showed in figure 27.
 |
| Figure27-- Dynamo program_method 1 for the goal of building volume |
However, my computer can't run the program successfully when I did the change. Thus, I used the second method to achieve the goal. It is to minimize the absolute value of the difference between the target floor area and the floor area that calculated by the input building dimensions. The target floor area is not given, so I used the target building volume divided by the floor height to get the value. The value is 253835 square foot. Figure 28 shows how I modified nodes in the "Test Optimo" node.
 |
| Figure28-- Dynamo program_method 2 for the goal of building volume |
Step 3_ Energy Use Intensity:
Another project goal is the Energy Use Intensity. It can also change some nodes in the "Test Optimo" node to achieve the goal. The original project goal is the annual energy use, so I need to divide the annual energy use by the total floor area to have the EUI. Figure 29 shows how I modified nodes in the "Test Optimo" node.
 |
| Figure29-- Dynamo program_Energy Use Intensity |
Step 4_ View Factor:
The last project goal is the view factor. It can also change some nodes in the "Test Optimo" node to achieve the goal. The target view factor is 0.7, so my method is to minimize the absolute value of the difference between 0.7 and the view factor. Figure 30 shows how I modified nodes in the "Test Optimo" node. In addition, the original project only has two goals, so I need to update the "Number of Objectives" node in the main program from 2 to 3.
| Figure30-- Dynamo program_View Factor |
RESULTS
The iteration number of my best result is only 2. I think it's because my computer performance is not good enough to run the Dynamo program if the iteration number is more than 2. Figure 31 is the best result that I can obtain so far. Figure 32 is my best result in 3-D view.
| Figure31-- The best result |
 |
| Figure 32-- The best result in 3-D view |
CRITIQUE
After running the program, I changed something and wanted to run it again. It didn't change the result in Revit, but it showed that run completed. I tried to disconnect some lines and reconnect again, and then run it. It still had the same result. Eventually, I have to close Dynamo and open again to run it. It's very inconvenient for me to do that.
Another drawback is Dynamo doesn't have object snap tracking feature. It's hard to align the gray small windows when I want the top of the windows at the same height.